
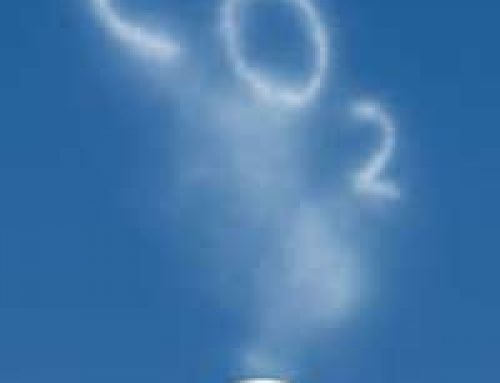
When you think about carbon emissions it is possible to think very small in terms of what every individual contributes on each day. At the other end of the spectrum figures are available to show the amount of carbon dioxide that is produced globally each year by different countries and regions of the world. Several websites now keep tally and produce league tables – usually based on the carbon emissions that were released two or three years ago. Collating the figures and making the tables takes time and the latest figures available in autumn 2010 were from 2007.
Contents
Top Five Countries for Carbon Emissions in 2007
China was the leading producer of carbon dioxide, accounting for just over 22% of the global total – producing a massive 6538367000 metric tons. Next was the USA, responsible for just over 19% of the global total, producing 5838381000 metric tons of carbon dioxide. These two countries therefore produce 41% of the world’s carbon emissions.
After the USA comes India with 1612362000 metric tons (5.5% of the global total), Russia with 1537357000 metric tons (5.24% of the global total) and Japan with 1254543000 with 4.28% of the global total.
Change in Carbon Emissions since 2003
The level of carbon emissions is constantly changing and a quick look at the figures from 2003, just five years earlier, show that a drastic change has occurred at the top of this league table. Then, the USA was the leading producer of carbon dioxide, with 5762050000 metric tons. Although its production has increased slightly over five years to 2007, the production rate in China has increased significantly. In 2003, it was 3473600000 metric tons – this has been almost doubled in the five years to 2007
The reason for this change is a cause of great concern to environmentalists, governments and ordinary people all over the world. China is the fastest growing country in the world in terms of industrialisation and this growth is being achieved at a great environmental cost.
Carbon Emissions in Europe
Several European countries feature in the top 25. Germany is the leader accounting for 2.69% of the world total; UK is next (1.84%), then France (1.27%), Spain (1.23%), Poland (1.08%). The United Kingdom is actually in 8th position, producing 539617000 metric tons of carbon dioxide each year. European countries known for their commitment to environmental principles and to reducing carbon emissions to protect the environment and prevent global warming getting worse – such as Sweden and Denmark – have much lower places in the table. Sweden and Denmark each account for only 0.17% of the global total of carbon emissions, with Norway producing 0.15%. Ireland does well too, also producing 0.15%.
Who are the Lowest Producers of Carbon Dioxide?
The countries further down the table, accounting for less than 0.1% of the global total tend to be either small developed countries (such as Luxembourg), small middle income countries (such as Barbados and the Maldives) or developing countries (such as Kenya and Sierra Leone. Very bottom of the list are independent islands such as the Cook Islands, the British Virgin Islands and Saint Helena, which all produce less than 0.01% of the global total.
Tackling Carbon Emissions Globally
The point of generating figures like these is to inform governments, companies and individuals of where the greatest problems lie. The USA has always been a big producer of carbon dioxide and the recent trend shows at best a stabilisation of production, rather than a decrease. This is despite the Kyoto Protocol, an international treaty that came into force in 2005 to set maximum targets for the emissions of carbon dioxide and five other major greenhouse gases. There was much debate about the agreement at the time, with countries such as the USA reluctant to sign up but more recently there seems to be greater acceptance that stringent action is needed to prevent global environmental problems.


